
Isometric ecosystem
The Future of Energy
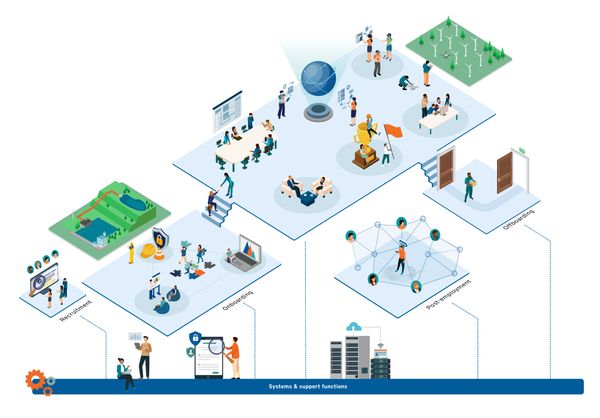
A custom-illustrated isometric ecosystem visualising the future of energy in Australia, with a focus on the impact to power and utilities companies in the next 30 years. This illustration takes research across energy tech growth areas, including AI, VR, renewable energy, and digital customer experiences to visually map our future energy space.
The process

Initial ideation
We mapped out the basic concept to ascertain which components needed to be produced, with this mapping created by our energy SME. A lot changed visually from the initial sketch!

Asset design
The majority of isometric illustration component were custom created by myself over the course of the project on Adobe Illustrator.
Asset library
Through this project we were able to create an isometric illustration asset library of custom illustrations related to the energy sector that could be utilised for other pieces of work.
This illustration on the left was also created by myself utilising some of the assets from the Future of Energy ecosystem illustration.